Where the money actually goes
Rees Calder · 17 April 2026 · 7 min read
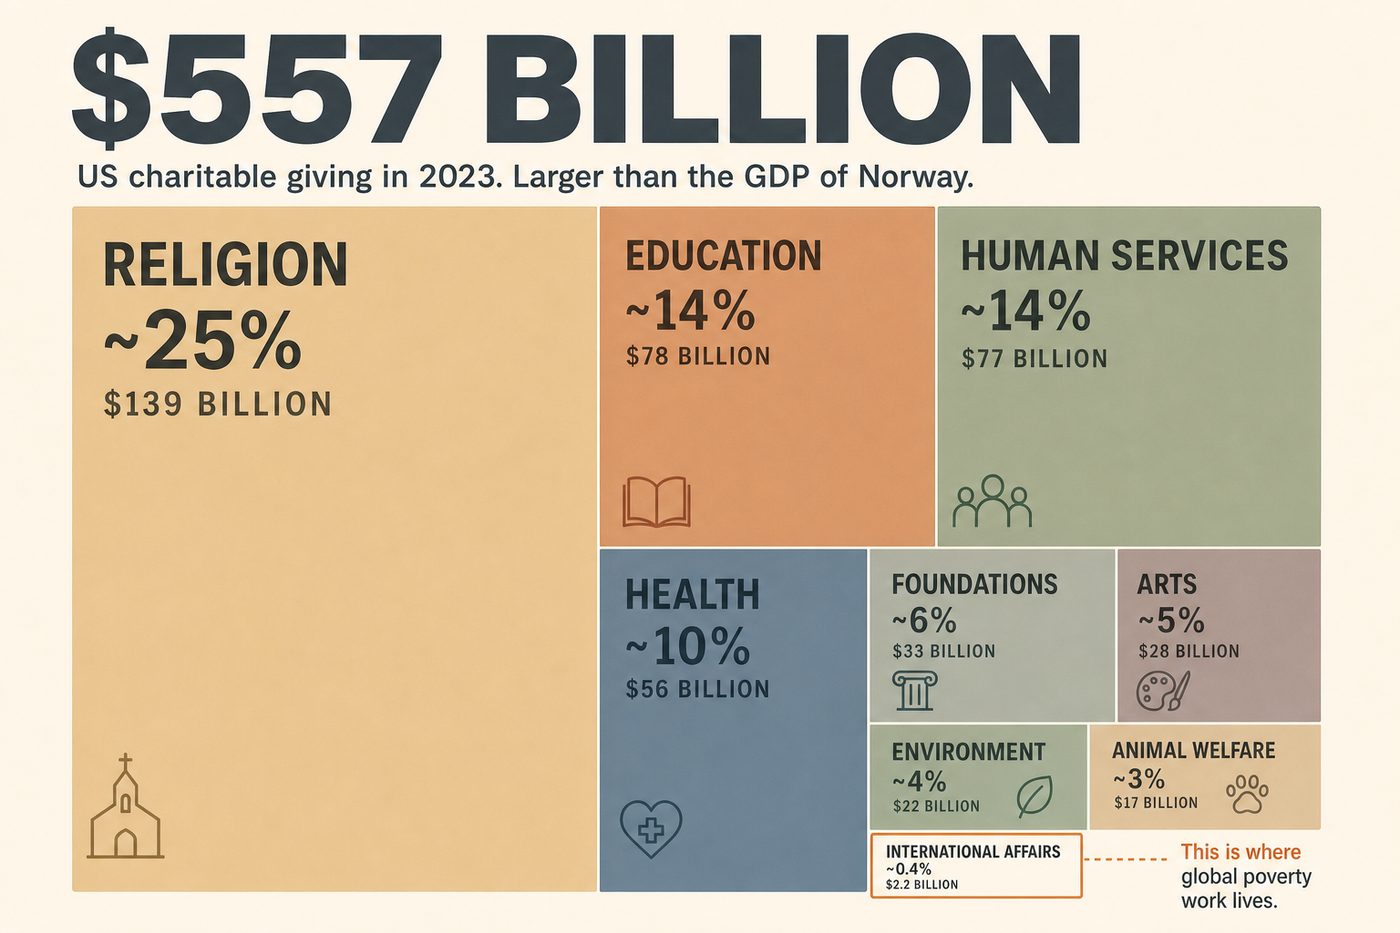
Americans gave $557 billion to charity in 2023. That is larger than the GDP of Norway. If even one percent of it landed on the most cost-effective global health programs, we would save more lives than we currently do in a decade.
That is not what happens.
The money goes where the money has always gone. Roughly a quarter to religion. About fourteen percent to education. Another fourteen percent to human services, mostly domestic. Ten percent or so to health, again mostly domestic. Grant-making foundations, arts, environment, international affairs, animal welfare, they split what is left. International affairs as a whole, the category that would include global poverty work, gets about five percent.
This is the map of American charitable giving, and it tells you almost nothing about where the biggest returns are.
The cost-per-outcome gap
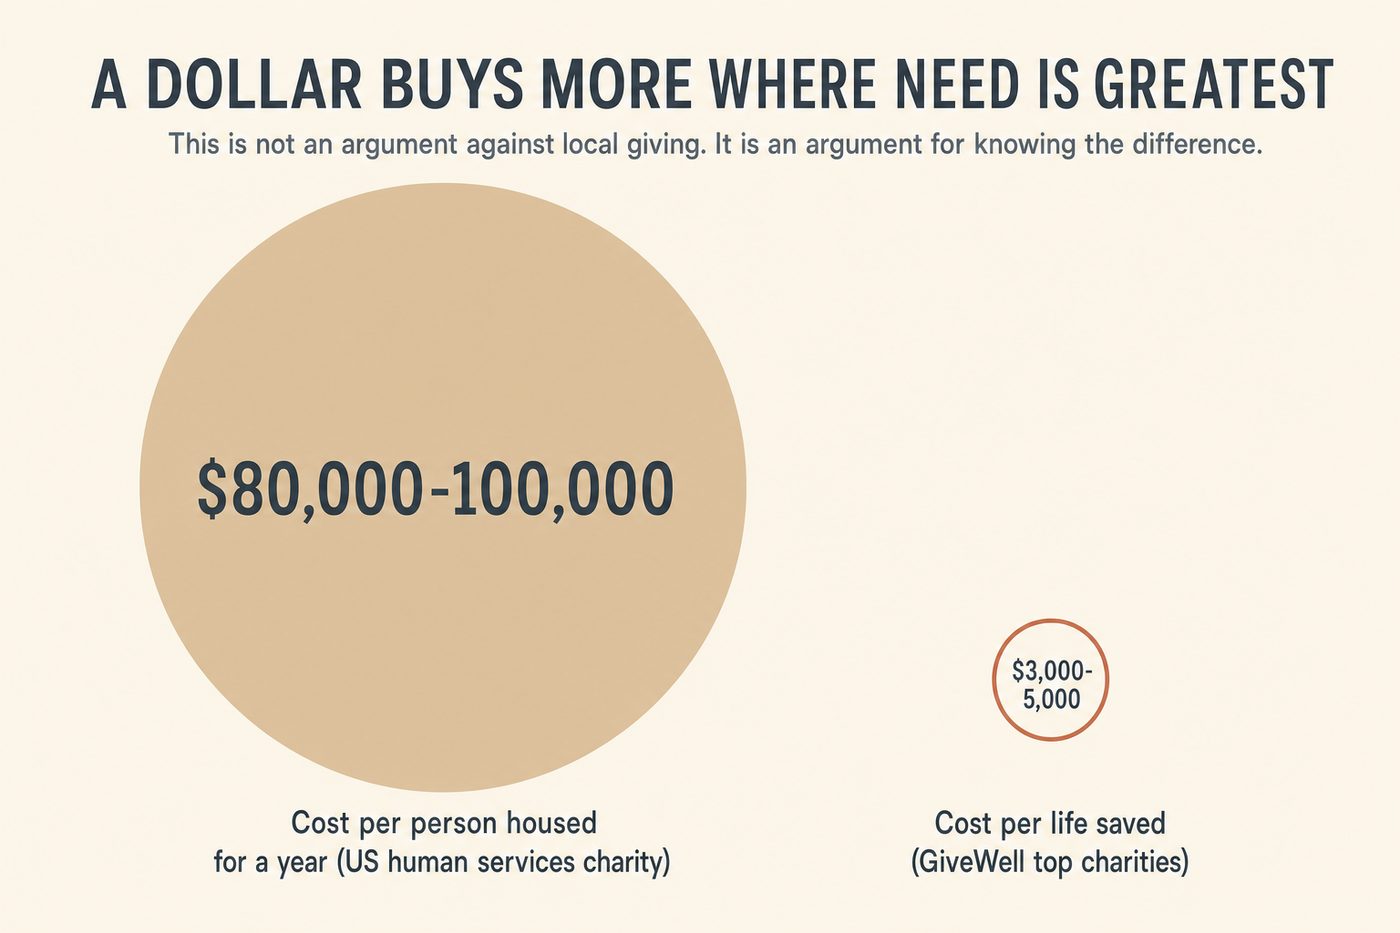
GiveWell, which has spent nearly two decades trying to find the best buy in global health, directs money into programs where the cost per life saved sits at roughly three to five thousand US dollars. Seasonal malaria chemoprevention and vitamin A supplementation have been the recurring answers. Against Malaria Foundation distributes insecticide-treated bednets at a cost per life saved that has fluctuated around that range depending on the country and the year.
Compare that to the average US charity. The single largest recipient category is religious institutions. Most of that money funds the local operations of the church, synagogue or mosque the giver attends. Useful, often meaningful, but the cost per external outcome is not comparable. A US-based human services charity might spend eighty to a hundred thousand dollars per person housed for a year, because the cost of existing in the United States is orders of magnitude higher than in Malawi or Burkina Faso. A dollar simply buys more disease prevention in a place where mosquitoes kill children.
This is the core gap. If you care about outcomes per dollar, the typical US donation is not close to the frontier. It is not within one order of magnitude. It is usually within three.
The institutional money is mostly one family
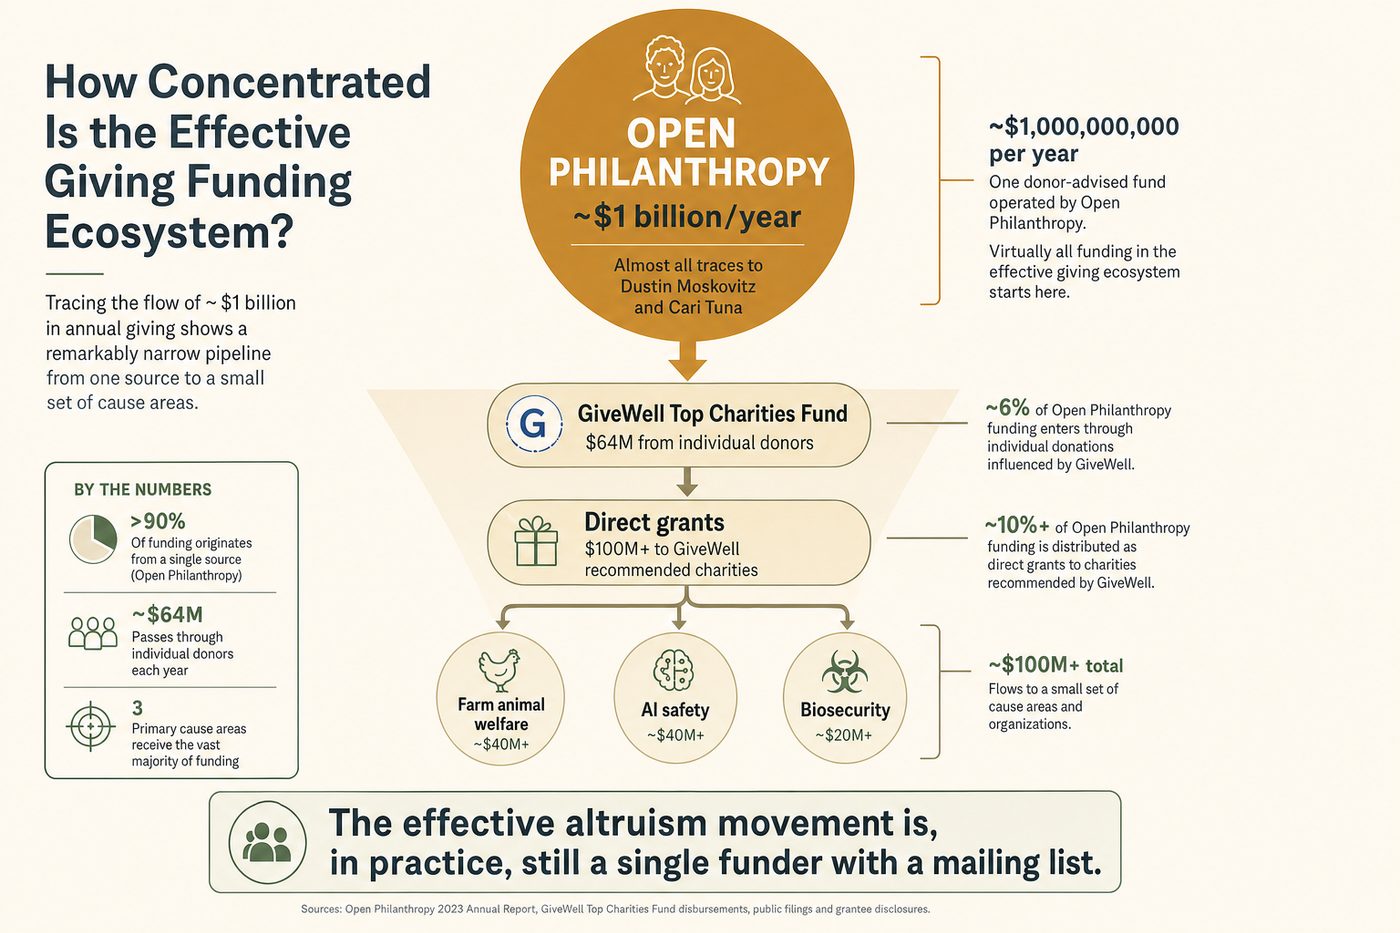
The deeper you go, the less diverse the funding picture gets. Open Philanthropy, the largest institutional funder in the effective giving world, deploys roughly a billion dollars a year across global health and development, farm animal welfare, AI safety, biosecurity and a few smaller programs. Almost all of that money traces back to Dustin Moskovitz and Cari Tuna. GiveWell's Top Charities Fund raised about sixty-four million from individual donors in 2024, and Open Philanthropy itself contributed another hundred million directly to GiveWell's recommended grants that year.
The effective altruism movement talks about diversifying away from a single donor. The movement is, in practice, still a single funder with a mailing list.
What gets left underfunded
Do Gooder
One good decision a week
The research behind each piece takes hours. Get the next evidence-backed read every Tuesday, in 3 minutes.
Free weekly read. Unsubscribe anytime, no guilt.
The striking bit is not that the big money ends up inside a few vehicles. It is what those vehicles fund that no one else will.
Farm animal welfare is the clearest example. Open Philanthropy put more than a hundred million dollars into corporate cage-free and broiler commitments, and into the legal and political groundwork behind them. Before that money arrived, almost nobody in traditional philanthropy treated chicken welfare as a serious line item. Roughly seventy billion land animals are slaughtered for food each year, most in conditions that would be illegal if applied to a dog. By any reasonable scope-sensitive standard this is a large problem. By traditional giving standards it gets less than half a percent of the pot.
Biosecurity sits in a similar spot. Funding for pandemic prevention, early warning systems, and lab safety collapsed in 2023 and 2024 as the post-Covid political window closed. Only a small handful of funders kept writing cheques. Most national governments went back to sleep.
Global mental health, tobacco control in low-income countries, lead poisoning abatement, road traffic injury prevention, all cluster in the same pattern. Very cheap per disability-adjusted life year saved. Almost no interest from the mainstream charitable sector.
Why the map stays wrong
The simple answer is that most people give locally to what they see. The less simple answer is that the infrastructure to help people give globally is almost entirely absent in the mass-market charity world. Workplace giving programs, donor-advised funds, church offerings, school appeals, the ice bucket challenge. None of them route you by default to the highest-evidence options. Most route you by default to causes that feel good.
There is nothing wrong with funding your local school or the church you attend. That is civic life. It is not, however, the same activity as trying to move the most suffering per dollar. If that is what you are trying to do, you almost certainly have to step off the default path.
The list of places where cost-per-outcome is well documented and small is shorter than people think. GiveWell's top charities page. The Open Philanthropy grants database. The Life You Can Save's recommended list. ACE's top animal charities. Founders Pledge's research notes. A handful of academic groups like the Centre for the Study of Existential Risk. That is most of the map. It is not a long list.
The one thing to do this week
Pick one recurring donation you already make. Look up the cost per outcome, or ask the charity for it. If they cannot tell you, or if the number is more than ten times higher than a comparable evidence-backed option, move half of that recurring donation to an evidence-backed charity of the same broad kind. Keep giving to the local cause, it is your civic life. But stop pretending the two buckets are doing the same job.
One small reallocation from a single donor is worth more than a hundred blog posts about giving better. That, finally, is what moving the map looks like.
Sources used
- Giving USA 2024 Annual Report on Philanthropy (2023 figures), Indiana University Lilly Family School of Philanthropy
- GiveWell, "GiveWell's 2024 Metrics and Impact," The GiveWell Blog, August 2025 (https://blog.givewell.org/2025/08/13/givewells-2024-metrics-and-impact/)
- Open Philanthropy, "Open Philanthropy's 2023-2025 funding of $300 million total for GiveWell's recommendations," EA Forum
- Against Malaria Foundation, cost-effectiveness estimates, GiveWell methodology notes 2024
- Compassion in World Farming / Open Philanthropy farm animal welfare programme reports, 2023-2024
- Food and Agriculture Organization, livestock production statistics, 2023
- Nuclear Threat Initiative, "Global Health Security Index 2023," pandemic funding tracker
More in The Map