The great decoupling
Rees Calder · 20 April 2026 · 6 min read
For most of the industrial era, GDP and carbon emissions climbed together. More economy, more fuel, more carbon. The relationship was so tight that for decades, most climate models assumed it was basically a law.
It isn't, any more.
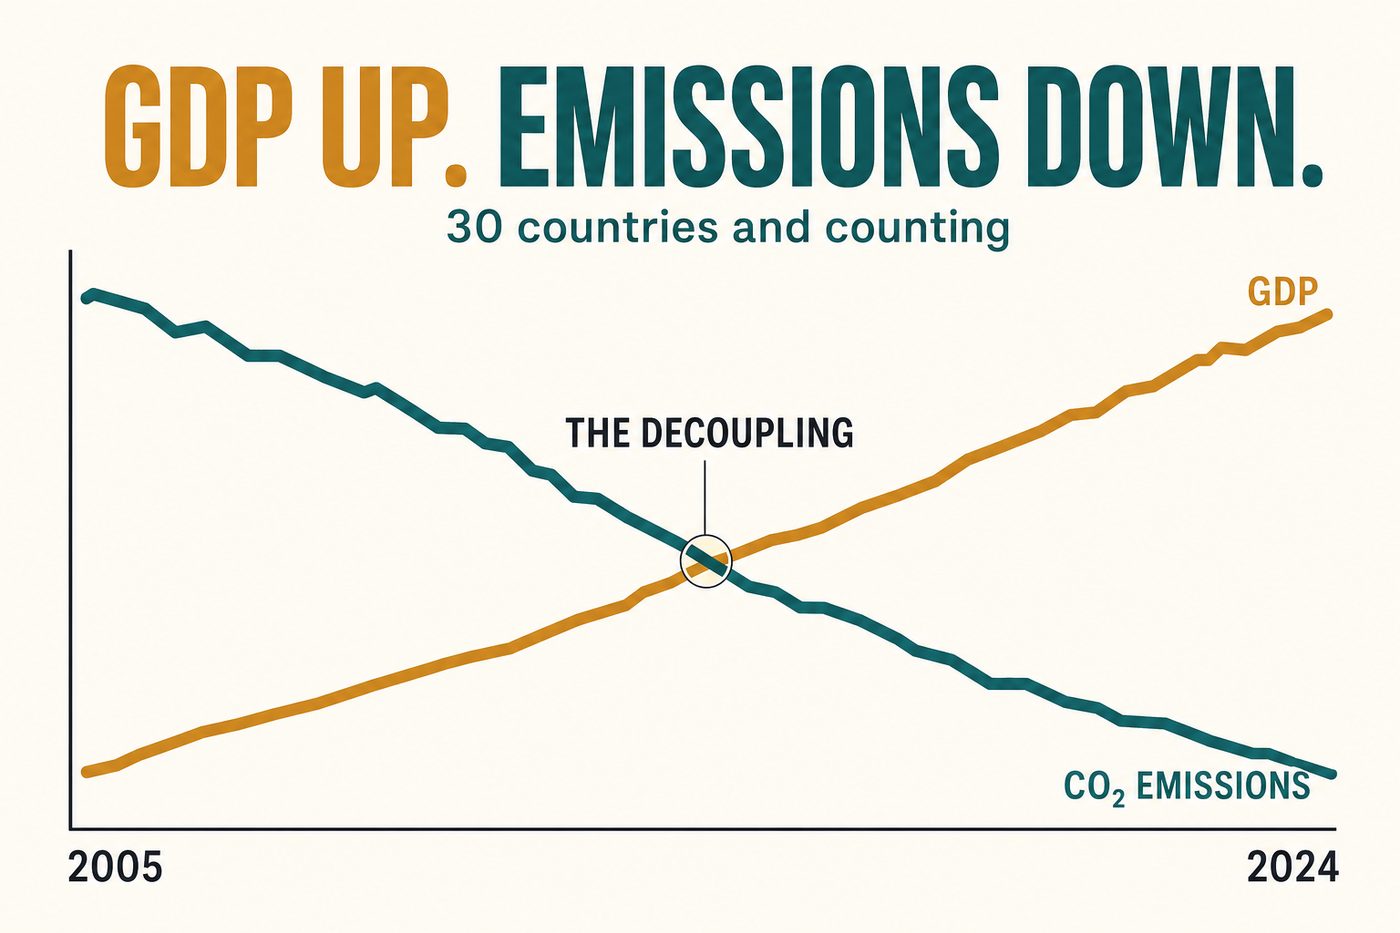
The International Energy Agency's 2023 and 2024 reports document what is now the standard result: in roughly 30 countries, including the UK, US, France, Germany, Denmark and most of Northern Europe, GDP has risen over the last 15 years while territorial CO2 emissions have fallen. This is "absolute decoupling", emissions going down while the economy goes up, and it's the single most important economic development of our lifetimes.
It is also, quietly, oversold. Here is the honest version.
What decoupling actually is
Two things to be careful about.
Relative vs. absolute decoupling. Relative decoupling is when emissions grow slower than GDP. This is necessary but insufficient. Absolute decoupling is when emissions fall while GDP rises. This is the thing we want. Many of the "decoupling" headlines conflate the two. Global relative decoupling has been happening for decades. Global absolute decoupling has not.
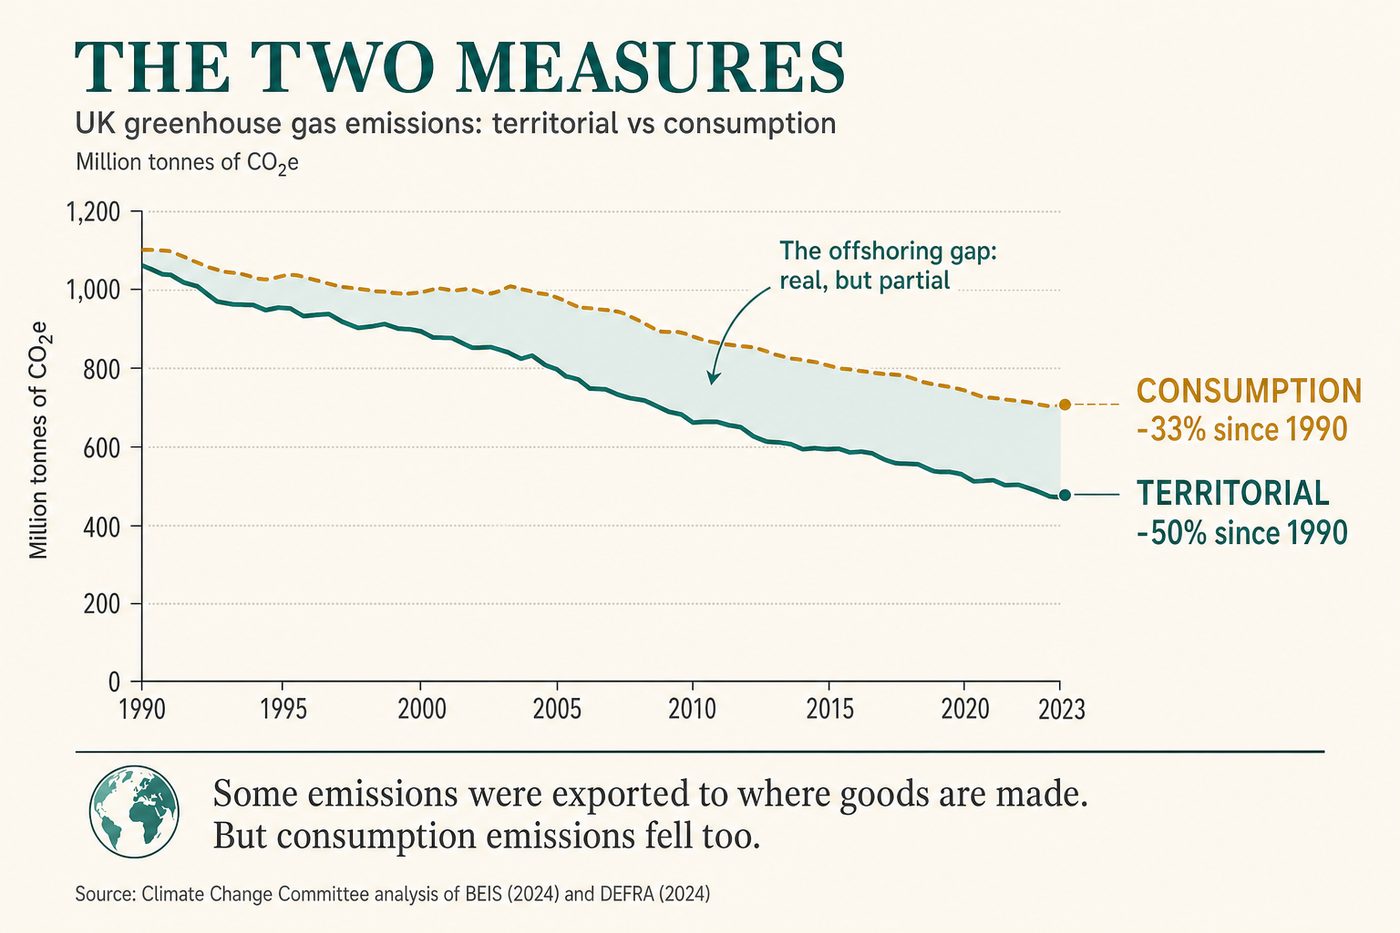
Territorial vs. consumption emissions. Territorial emissions count what is emitted inside a country's borders. Consumption emissions count what a country's citizens consume, including imports. The UK's territorial emissions have fallen ~50% since 1990 (UK BEIS data). The UK's consumption-based emissions have fallen more modestly, around 33-35% (ONS carbon footprint data). Some of the difference is offshored to places like China, where the goods are made. Some is genuine.
The steelman view: consumption emissions for most decoupled countries have also fallen, just less dramatically than territorial. So the offshoring explanation is real but partial, not the whole story.
What actually drove the decoupling
Four factors, ranked roughly by contribution.
Electricity sector decarbonisation. The single biggest driver, by a wide margin. The UK's grid carbon intensity has fallen ~75% since 2010 as coal plants closed and wind/gas/solar expanded. This is cheap to model, easy to take political credit for, and it has done most of the heavy lifting in every decoupled country.
Efficiency gains. Industrial processes, buildings, and vehicles use less energy per unit of output. Some of this is genuine technical progress, some is a statistical artefact of the economy shifting from manufacturing toward services, which are less energy-intensive.
Structural shift. Rich countries have moved from making things to providing services. A country that writes software has lower territorial emissions than one that smelts steel, even if its citizens consume the same amount of both.
Behaviour and demand. Smaller contribution than people think. The IEA attributes under 10% of recent OECD emissions reductions to demand-side behaviour change.
Why the decoupling is more fragile than it looks
Do Gooder
One good decision a week
The research behind each piece takes hours. Get the next evidence-backed read every Tuesday, in 3 minutes.
Free weekly read. Unsubscribe anytime, no guilt.
Three reasons for caution.
One: the easy wins go first. The decoupling so far has been driven largely by replacing coal with gas + renewables in the electricity sector. This was the low-hanging fruit. The hard part is decarbonising the rest: heating (heat pumps into old housing stock), heavy industry (cement, steel), aviation, shipping, agriculture. Progress on these is much slower. The IEA's 2024 Tracking Clean Energy Progress report rates only 3 of 35 sectors as "on track" for the trajectory consistent with net zero by 2050.
Two: the rebound effect is real. Cheaper, cleaner energy can increase demand. Efficient LED lights got used more. Electric cars unlock miles that wouldn't have been driven in a combustion car at the same fuel cost. The Jevons paradox (1865) keeps showing up. Bergin et al. 2023 find rebound effects of 10-20% for typical efficiency investments, meaning a 10% efficiency gain captures only 8-9% emissions reductions.
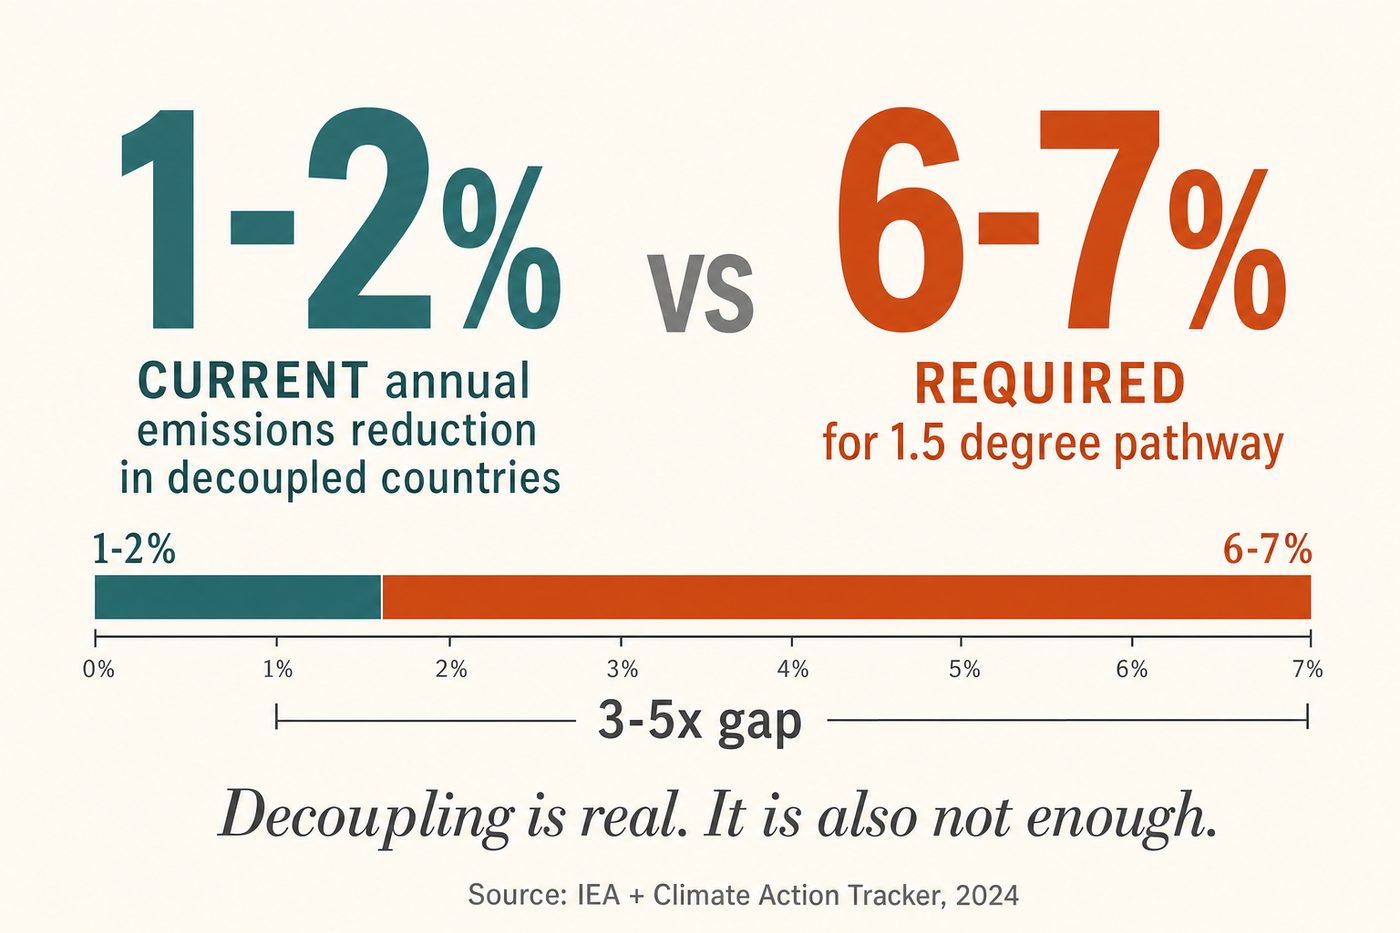
Three: decoupling doesn't compound mechanically. The rate at which rich countries are decoupling (~1-2% emissions per year reductions while GDP grows 1-2%) is nowhere near the rate required for 1.5°C pathways (~6-7% per year reductions from current levels). Being on a decoupling trajectory is good. Being on the 1.5°C trajectory is a much harder problem, and no major economy is actually on it.
Why this matters for the individual decision-maker
Three translations.
Electricity sector wins matter more than your personal consumption. If you live in a country with a rapidly decarbonising grid, electrifying your home, car, and appliances pays large ongoing dividends, even if the first-day impact seems modest. Your EV in 2026 is dirtier than your EV in 2035 on the same grid.
Offsets for residual emissions need to be priced at marginal abatement, not average. The cheap emissions reductions are gone. The remaining ones cost more. Offset pricing that relies on $3-10 per tonne CO2e is pricing the past. The marginal abatement cost curve for 2030 sits closer to $50-200 per tonne (IEA + IPCC WG3 2022). Your "I'll just offset" strategy is under-budgeted by roughly an order of magnitude.
Policy matters more than individual action at this stage. Most of the decoupling has come from government policy (closing coal plants, subsidising renewables, tightening vehicle standards) rather than consumer choice. The marginal returns on supporting good climate policy (via voting, advocacy, donations to climate-policy organisations) are now larger than the marginal returns on most personal consumption changes.
The big open question
Whether absolute decoupling can be accelerated enough to put rich countries on a 1.5°C-consistent path while emerging economies are still growing fast. The arithmetic is not comforting. Current OECD decoupling is ~1-2% per year. The required rate for 1.5°C is ~6-7% per year from here. The gap isn't closed by efficiency gains alone. It requires aggressive electrification, large-scale deployment of negative emissions, and harder decisions about aviation, agriculture and consumption.
The honest frame. Decoupling is real, meaningful, and under-celebrated by the public debate. It's also not, by itself, enough. The decoupling trend plus current policy does not get us to 1.5°C. It probably gets us to 2.4-2.7°C (CAT Climate Action Tracker 2024). Better than 4°C. Worse than 1.5°C. That's the uncomfortable middle we are actually in.
A one-line takeaway
Absolute decoupling in rich countries is the best climate news of the last decade, and it is not enough. Both things are true.
Sources used: IEA World Energy Outlook (2023, 2024), IEA Tracking Clean Energy Progress (2024), UK BEIS Final UK Greenhouse Gas Emissions (2023-24), UK ONS Carbon Footprint Statistics (2024), Climate Action Tracker Global Update (November 2024), IPCC AR6 Working Group III (2022), Bergin et al., Rebound Effects in Energy Efficiency, Energy Economics (2023). Full links in the planning doc.
More in The Map