The giving journal
Rees Calder · 4 May 2026 · 7 min read
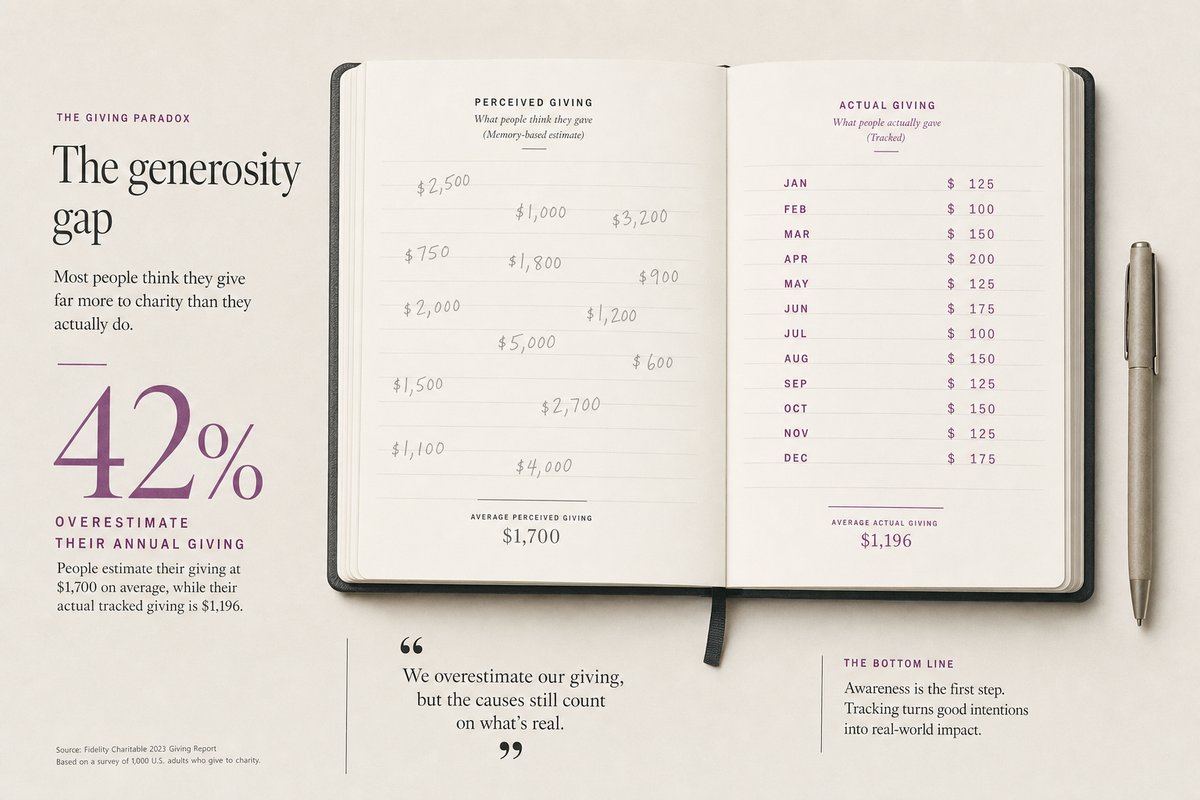
Here's a number that should unsettle you: when Fidelity Charitable surveys donors about how much they gave last year, the average respondent overestimates by 42%. Not a rounding error. Nearly half again more than reality.
This isn't dishonesty. It's the gap between intention and attention. People who care about giving but don't track it are operating on feeling rather than data. They remember the emotional highlights (the disaster appeal, the friend's fundraiser, the Christmas donation) and forget the months where nothing happened at all.
A giving journal closes this gap. Not a spreadsheet. Not a budgeting app. A structured reflective practice that turns giving from something that happens to you into something you do deliberately.
Why reflection improves performance
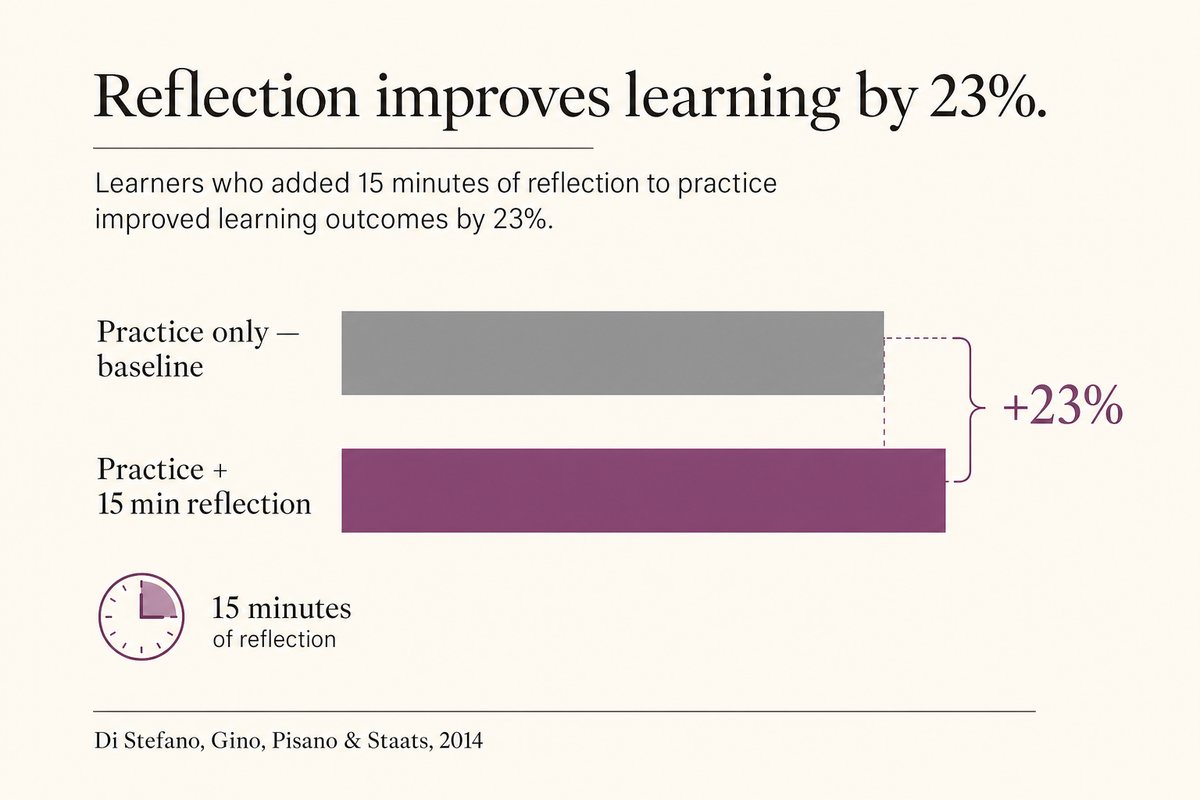
The research is clear: reflection makes people better at what they do. Not marginally better. Significantly better.
The Di Stefano study. Giada Di Stefano, Francesca Gino, Gary Pisano, and Bradley Staats (Harvard Business School, 2014) ran a series of experiments showing that people who spent 15 minutes at the end of each day reflecting on what they'd learned performed 23% better on final assessments than those who simply kept practising. Fifteen minutes of thinking outperformed fifteen minutes of doing.
The mechanism isn't mysterious. Reflection forces you to articulate what worked, what didn't, and what you'd change. This moves knowledge from implicit (felt but unexamined) to explicit (stated and revisable). Once explicit, beliefs can be tested, updated, and improved.
Applied to giving. Most donors never reflect on their giving in any structured way. They give, feel good, and move on. There's no moment where they ask: "Did this donation do what I hoped? Was the cause I chose actually neglected? Would a different allocation have done more good?" Without reflection, there's no learning curve. Year ten looks like year one.
What a giving journal contains
This isn't a complicated system. It's five fields and fifteen minutes per month.
1. What I gave this month. Amount, recipient, date. The bare facts. This alone eliminates the 42% overestimation problem because you have actual numbers instead of memory.
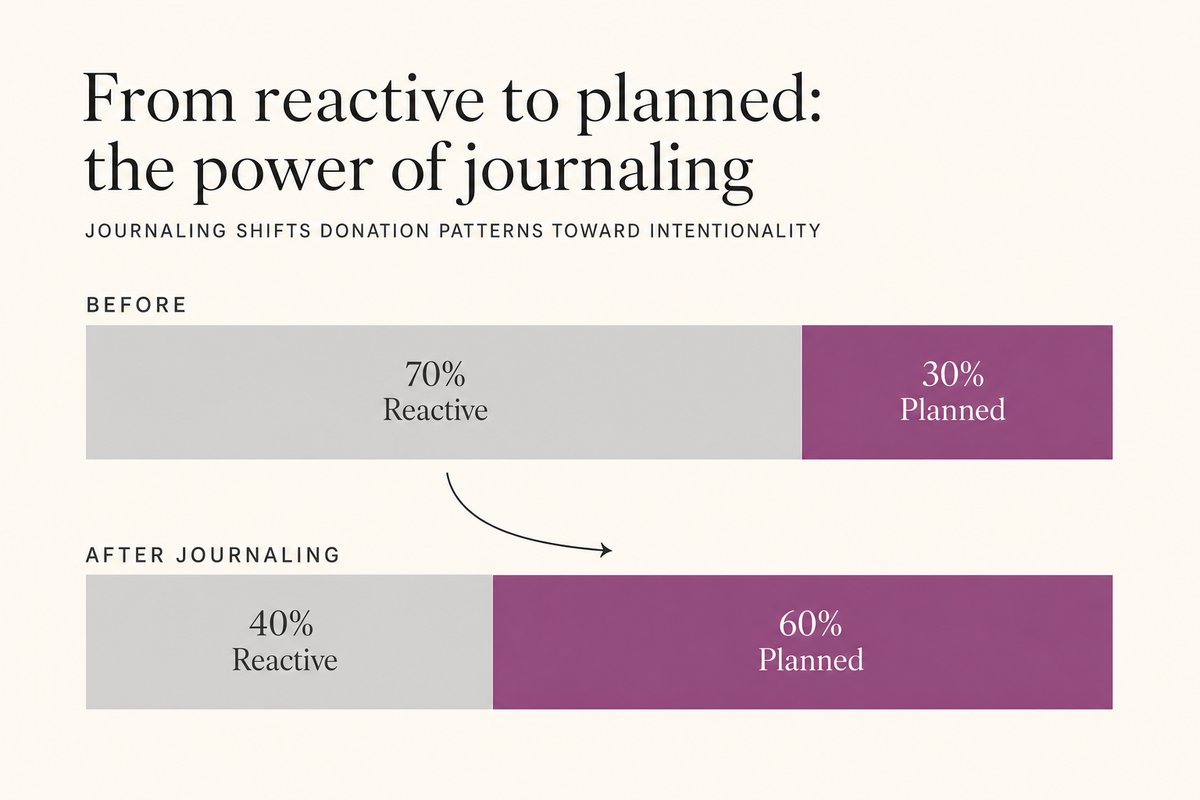
2. Why I gave it. Was this planned or reactive? Did something prompt it (an appeal, a news story, a friend's request)? There's no wrong answer, but tracking the pattern reveals something. If 80% of your giving is reactive, you're outsourcing your allocation decisions to whoever asks most persuasively or whatever crisis is in the news.
3. What I believe it achieved. This doesn't require impact measurement. It requires you to state an expectation. "I believe this $50 to AMF bought roughly 10 bed nets and will prevent approximately 0.01 deaths from malaria." You might be wrong. The point is having a falsifiable expectation you can check later.
4. What I'd do differently. Only fill this in quarterly, not monthly. After three months of data, look back: any patterns you want to change? Giving too reactively? Neglecting a cause area you care about? Spreading too thin across too many organisations?
5. What I'm planning next. A one-line intention for next month. "Continue monthly AMF standing order" or "Research animal welfare charities for Q3 reallocation." This creates what Gollwitzer (1999) calls an implementation intention: a specific plan that's 2-3x more likely to be executed than a vague goal.
The compound effect
Do Gooder
One good decision a week
The research behind each piece takes hours. Get the next evidence-backed read every Tuesday, in 3 minutes.
Free weekly read. Unsubscribe anytime, no guilt.
A giving journal that's maintained for a year produces something powerful: a complete record of your giving year that enables genuine review.
Annual review. At year end, you can answer questions most donors cannot: How much did I give in total? What percentage of my income was that? How was it distributed across cause areas? What fraction was planned versus reactive? How does this compare to last year? Did my beliefs about impact change?
The Quoidbach insight. Jordi Quoidbach's research on the "end of history illusion" (Science, 2013) found that people consistently underestimate how much their values and preferences will change in the future. This applies to giving: the charities you support today may not be the ones you'd choose in five years. A journal creates a longitudinal record that reveals this drift, making it conscious rather than invisible.
The GWWC parallel. Giving What We Can's reporting system works on the same principle. Members report donations annually, see their lifetime total grow, and can compare year-on-year. The community has moved over $500 million, and members report that the tracking system is one of the key mechanisms that keeps them on track. You don't need to take the 10% pledge to use their dashboard. It's free and open to anyone.
Common failure modes
Over-engineering. The biggest risk is building a system so complex you abandon it in three weeks. Five fields. Fifteen minutes. Monthly. That's it. If you find yourself designing colour-coded spreadsheets with twelve tabs, stop. The journal that gets used monthly for ten years beats the perfect system that dies in January.
Guilt spiralling. The point of tracking isn't to generate guilt about giving less than you "should." It's to make your actual giving visible so you can make conscious choices about it. If reviewing your journal makes you feel terrible, the problem might be the expectations, not the giving.
Neglecting the qualitative. Numbers matter, but so does the story. The best giving journals include brief notes about how giving felt, what you learned about an issue, or why you changed your mind. These narrative entries are what make the annual review genuinely useful rather than just a ledger.
Three formats that work
The paper notebook. A dedicated section in a regular journal or a standalone pocket notebook. Write the five fields monthly. Review quarterly. One page per month means a full year fits in twelve pages. The advantage of paper: zero friction, no app to open, no data privacy concerns.
The simple spreadsheet. A single Google Sheet with columns for date, amount, recipient, planned/reactive, and notes. Add a row per donation. Use a pivot table or simple SUM formula at year end. The advantage of digital: automatic totals, searchable, shareable with a partner if you give jointly.
The GWWC dashboard. If you already use Giving What We Can's platform (or want to start), their "My Giving" page tracks donations, calculates percentage of income, and shows your trajectory over time. The advantage: community context, comparison to your own past, and external accountability.
What the research predicts
If the Di Stefano findings generalise (and there's good reason to believe they do), donors who maintain a giving journal for a year should see measurable improvements in:
Allocation quality. More giving directed to high-impact organisations because you're regularly reviewing whether your choices align with your values. Less reactive giving to whatever lands in your inbox.
Consistency. Fewer months of zero giving followed by guilt-driven large donations. A smoother, more sustainable pattern that's easier on your budget and better for charities (who prefer predictable income).
Total amount. Not because you're guilting yourself into more, but because planned giving with implementation intentions tends to exceed unplanned giving. The GWWC data supports this: pledgers give 2-3x more than they estimate they would have given without the structure.
Satisfaction. Research on donor experience (Aknin, Dunn & Norton, 2012) shows that giving produces more happiness when it feels deliberate and connected to identity. A journal makes giving feel like an ongoing practice rather than isolated transactions. The wellbeing return on giving increases when you pay attention to it.
Start this month
The minimum viable giving journal is a note on your phone with today's date, what you gave this month, and one sentence about why. That's it. You can add structure later. The only thing that matters is that you start tracking before your next donation, so you capture the full picture rather than reconstructing from memory.
Fifteen minutes per month. 23% better performance. The maths on reflection are as clear as the maths on bed nets.
More in The Life Edit